Every pool hall owner has a table they notice first. Maybe Table 1 is near the counter and always seems occupied. Maybe Table 8 is where weekend groups gather. Maybe the league players ask for the same equipment every Wednesday.
The busiest table is not automatically the highest-value table. A table can be occupied for many hours and still earn less per occupied hour than another table. Another table may be used less often but produce stronger table-time revenue when it is used. A third table may look average across the whole week but dominate one important daypart.
The better question is not "which table is busiest?" It is "which tables are producing the strongest combination of utilization and revenue?"
What Should You Measure for Each Table?
Table hours describe capacity. If one table is available for one hour, that is one available table-hour. Ten tables open for eight hours create 80 available table-hours.
Occupied hours show how much of that capacity customers actually used. This is the foundation for understanding table utilization.
Utilization compares occupied time with available time. It tells you whether a table is sitting open, frequently in use, or under capacity pressure during the period you are reviewing.
Session count shows how many distinct sessions a table hosted. Two tables can have similar occupied hours but very different session patterns.
Average session length explains whether occupied hours are coming from long visits, quick turns, or a mix of both.
Table-time revenue is the direct revenue generated from table time. It is not the same as net profit, and it should not be treated as the entire value of a customer visit.
Revenue per occupied table-hour compares table-time revenue with the hours actually occupied. It is one of the cleanest ways to see whether a table is only busy, or busy and earning well.
Where relevant, owners may also compare waitlist pressure and food or drink attachment, especially if certain tables are tied to longer visits, larger groups, or premium customer behavior.
Why Revenue per Table-Hour Matters
Revenue per occupied table-hour is simple:
Table-time revenue divided by occupied table-hours.
Here is an illustrative example:
Table 3 is the busiest in this example, with 50 occupied hours. Table 2 is used less, with 31 occupied hours, but earns more per occupied table-hour. Table 1 sits in the middle.
That does not automatically make Table 2 "best" or Table 3 "bad." It simply shows why activity and yield need to be reviewed together. If you rank by occupied hours, Table 3 wins. If you rank by revenue per table-hour, Table 2 wins. Each ranking answers a different question.
Busiest Table vs Highest-Revenue Table
The busiest table and the highest-revenue table often differ because tables are not used in the same way.
One table may be popular with pass holders or discounted play. Another may be used more often during peak-rate periods. A premium table may attract fewer sessions but command a higher rate. A front-of-room table may turn over quickly with casual players, while a back table may host longer sessions from regulars.
Session length also matters. Longer sessions can be good if the rate structure supports them. They can be weaker if the session is tied to low off-peak pricing, heavy pass usage, or a discount that reduces table-time revenue per hour.
Compare Tables by Daypart
Whole-week averages can hide the operating pattern you actually need to manage.
For example, Table 3 might be strong on weekday league nights. Table 8 might dominate weekend walk-in traffic. Table 1 might be consistently occupied but mostly during off-peak periods. If all of that is blended into one weekly number, the owner may miss the real story.
Daypart comparisons can answer more practical questions:
- Which tables are strongest during peak demand?
- Which tables are mostly used during slower periods?
- Which tables carry league or event activity?
- Which tables create waitlist pressure when the room is full?
- Which tables produce strong table-time revenue when they are occupied?
The point is not to micromanage every table every hour. It is to compare like with like. Friday evening behavior should not be treated the same as Tuesday afternoon behavior.
Four Patterns to Look For
These patterns are prompts for investigation, not automatic diagnoses.
The matrix keeps owners from assuming "busy" always means valuable or dismissing lower-utilization tables that earn well when occupied.
For a deeper look at the utilization side of the equation, see What Is a Good Pool Table Utilization Rate?. If the evidence points toward a pricing review, When Should You Raise Your Pool Table Rates? covers the signals to evaluate before changing rates.
Look for Underperforming Tables
An underperforming table is not necessarily a table that should be removed. It is a table that deserves a closer look.
Possible signals include low utilization, low session count, low table-time revenue, weak revenue per occupied hour, or poor performance during the dayparts where that table should be useful. The cause may have nothing to do with pricing.
Location can matter. A table near congestion, restrooms, service traffic, or a less visible corner may be chosen less often. Equipment condition, lighting, spacing, or perceived table quality can change customer preference too.
The data should lead to questions:
- Is the table underused across the whole week, or only in certain periods?
- Do customers avoid it when other tables are available?
- Does it perform better for leagues, regulars, or casual groups?
- Is there a maintenance issue affecting demand?
- Would layout, signage, lighting, or table assignment practices change usage?
Do not diagnose automatically. Use table-level data to decide what deserves a floor-level inspection.
High Utilization and Low Revenue per Hour
A table with high utilization and low revenue per occupied hour can be tricky. It may be genuinely valuable because it brings people into the room, supports regulars, or drives food and drink sales. But it may also indicate that table-time revenue is not keeping up with demand.
Possible explanations include discounted rates, heavy pass usage, long low-rate sessions, off-peak concentration, or a pricing structure that keeps the table busy without producing much table-time revenue per hour.
The answer is not always "raise the rate." The better first step is to understand why the yield is low and whether the table is creating value elsewhere in the visit.
Low Utilization and High Revenue per Hour
The opposite pattern is also interesting. A table with low utilization and high revenue per occupied hour may be a premium table, a specialty table, a table mostly used during peak periods, or simply a table that earns well when it is chosen.
That can be a good sign, but it may also reveal unused capacity. If the table earns strongly when occupied but sits empty too often, the owner may review placement, promotion, league use, event scheduling, or whether customers understand what makes the table worth choosing.
What Decisions Can Table-Level Data Support?
Table-level reporting can support better discussions about pricing, layout, maintenance, promotions, and future investment.
If premium tables consistently earn more per occupied hour, that may inform how they are positioned or scheduled. If certain tables underperform despite strong room demand, maintenance or layout may move up the priority list. Before buying, replacing, or moving tables, owners can review which parts of the room are actually constrained and which tables are not reaching their potential.
None of this guarantees an outcome. It simply gives the owner a better starting point than instinct alone.
What Not to Do
Avoid ranking tables by one busy night. Tournaments, holidays, weather, private events, and league playoffs can distort normal patterns.
Avoid ranking only by gross table-time revenue. A table with high total revenue may simply have more occupied hours, while another table may produce stronger revenue per occupied hour.
Avoid ignoring utilization. High yield on very few occupied hours may still leave a lot of unused capacity.
Avoid assuming underuse means the table should be removed. It may need maintenance, better placement, clearer assignment, a different role, or a longer review window.
Avoid ignoring daypart differences. A table that matters on Saturday night may look ordinary in a full-week average. Most of all, avoid overreacting to short windows. Compare meaningful periods and similar conditions before making major changes.
How BilliardsManager Analytics Engine Helps
BilliardsManager Analytics Engine is built to give pool hall owners clearer visibility into table performance, including table utilization, table hours, session counts, revenue per table or hour, daily table-time revenue, and reporting by table where supported.
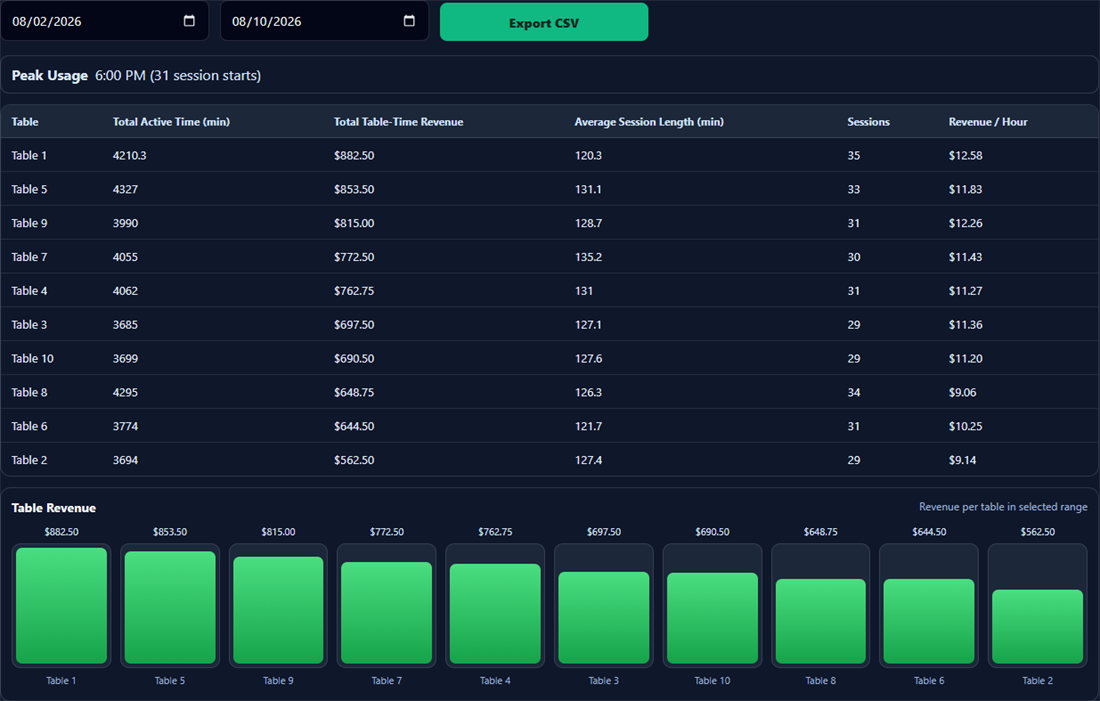
That visibility does not calculate net profit per table, automatically recommend prices, predict maintenance needs, or optimize rates for you. It gives owners practical operating data from their own room so they can compare usage and revenue together.
For a broader product view, see BilliardsManager features, pool hall management software, or request a demo.
Conclusion
The table that looks busiest is not necessarily the table creating the most value.
Owners should compare occupied table-hours, utilization, session count, average session length, table-time revenue, revenue per occupied table-hour, daypart patterns, waitlist pressure, and food or drink context where relevant.
The goal is not to crown one table forever. The goal is to understand which tables are producing the strongest combination of usage and revenue over meaningful periods, and which tables deserve a closer look.